Chapter 1 Introduction
1.1 Why this book?
The world has changed for empirical social scientists. The new types of “big data” have generated an entire new research field—that of data science. That world is dominated by computer scientists who have generated new ways of creating and collecting data, developed new analytical techniques and provided new ways of visualizing and presenting information. The results have been to change the nature of the work that social scientists do.
Social scientists have been enthusiastic in responding to the new opportunity. Python and R are becoming as, and hopefully more, well-known as SAS and Stata—indeed, the 2018 Nobel Laureate in Economics, Paul Romer, is a Python convert (Kopf 2018). Research has also changed. Researchers draw on data that are “found” rather than “made” by federal agencies; those publishing in leading academic journals are much less likely today to draw on preprocessed survey data (Figure 1.1). Social science workflows can become more automated, replicable and reproducible (Yarkoni et al. 2019).
![Use of pre-existing survey data in publications in leading journals, 1980--2010 [@Chetty2012]](ChapterIntro/figures/Figure1.png)
Figure 1.1: Use of pre-existing survey data in publications in leading journals, 1980–2010 (Chetty 2012)
Policy has also changed. The Foundations of Evidence-based Policy Act, which was signed into law in 2019, requires agencies to make use of evidence and data in making policy decisions (Hart 2019). The Act, together with the Federal Data Strategy (Office of Management and Budget 2019) establishes both Chief Data Officers to oversee the collection, use of and access to many new types of data and a learning agenda to build the data science capacity of agency staff.
And the jobs have changed. The new job title of “data scientist” is highlighted in job advertisements on CareerBuilder.com and Burningglass—supplanting the demand for statisticians, economists, and other quantitative social scientists if starting salaries are useful indicators. At the federal level, the Office of Personnel Management created a new data scientist job title.
The goal of this book is to provide social scientists with an understanding of the key elements of this new science, value of the tools, and the opportunities for doing better work. The goal is also to identify the many ways in which the analytical toolkits possessed by social scientists can enhance the generalizability and usefulness of the work done by computer scientists.
We take a pragmatic approach, drawn on our experience of working with data to tackle a wide variety of policy problems. Most social scientists set out to solve a real world social or economic problem: they frame the problem, identify the data, do the analysis, and then draw inferences. At all points, of course, the social scientist needs to consider the ethical ramifications of their work, particularly respecting privacy and confidentiality. The book follows the same structure. We chose a particular problem—the link between research investments and innovation—because that is a major social science policy issue, and one in which social scientists have been addressing using big data techniques.
1.2 Defining big data and its value
There are almost as many definitions of big data as there are new types of data. One approach is to define big data as anything too big to fit onto your computer.1 Another approach is to define it as data with high volume, high velocity and great variety. We choose the description adopted by the American Association of Public Opinion Research: “The term ‘’Big Data’’ is an imprecise description of a rich and complicated set of characteristics, practices, techniques, ethical issues, and outcomes all associated with data” (Japec et al. 2015).
The value of the new types of data for social science is quite substantial. Personal data have been hailed as the “new oil” of the 21st century (Greenwood et al. 2014). Policy-makers have found that detailed data on human beings can be used to reduce crime (Lynch 2018), improve health delivery (Pan et al. 2017) and manage cities better (Glaeser 2019). Society can gain as well—much cited work shows data driven businesses were five percent more productive and six percent more profitable than their competitors (Brynjolfsson, Hitt, and Kim 2011). Henry Brady provides a succinct overview when he says “Burgeoning data and innovative methods facilitate answering previously hard-to-tackle questions about society by offering new ways to form concepts from data, to do descriptive inference, to make causal inferences, and to generate predictions. They also pose challenges as social scientists must grasp the meaning of concepts and predictions generated by convoluted algorithms, weigh the relative value of prediction versus causal inference, and cope with ethical challenges as their methods, such as algorithms for mobilizing voters or determining bail, are adopted by policy makers” (Brady 2019).
Example: New potential for social science
The billion prices project is a great example of how researchers can use new web-scraping techniques to get online prices from hundreds of websites and thousands of webpages to build datasets customized to fit specific measurement and research needs in ways that were unimaginable 20 years ago (Cavallo and Rigobon 2016); other great examples include the way in which researchers use text analysis of political speeches to study political polarization (Peterson and Spirling 2018) or of airbnb postings to get new insights into racial discrimination (Edelman, Luca, and Svirsky 2017).
Of course, these new sources come with their own caveats and biases that need to be considered when drawing inferences. We will cover this later in the book in more detail.
But most interestingly, the new data can change the way we think about behavior. For example, in a study of environmental effects on health, researchers combined information on public school cafeteria deliveries with children’s school health records to show that simply putting water jets in cafeterias reduced milk consumption and also reduced childhood obesity (Schwartz et al. 2016). Another study which shed new light into the role of peers on productivity found that the productivity of a cashier increased if they were within eyesight of a highly productive cashier but not otherwise (Mas and Moretti 2009). Studies like these show ways in which clever use of data can lead to greater understanding of the effects of complex environmental inputs on human behavior.
New types of data can also enable us to study to examine small groups—the tails of a distribution—in a way that is not possible with small data. Much of interest in human behavior is driven by those tails—health care costs by small numbers of ill people (Stanton and Rutherford 2006), economic activity and employment by a small number of firms (Evans 1987, Jovanovic (1982)).
Our excitement about the value of new types of data must be accompanied by a recognition of the lessons learned by statisticians and social scientists from their past experience with surveys and small scale data collection. The next sections provide a brief overview.
1.3 The importance of inference
It is critically important to be able to use data to generalize from the data source to the population. That requirement exists, regardless of the data source. Statisticians and social scientists have developed methodologies for survey data to overcome problems in the data-generating process. A guiding principle for survey methodologists is the total survey error framework, and statistical methods for weighting, calibration, and other forms of adjustment are commonly used to mitigate errors in the survey process. Likewise for “broken” experimental data, techniques like propensity score adjustment and principal stratification are widely used to fix flaws in the data-generating process.
If we take a look across the social sciences, including economics, public policy, sociology, management, (parts of) psychology and the like, their scientific activities can be grouped into three categories with three different inferential goals: Description, Causation and Prediction.
Description
The job of many social scientists is to provide descriptive statements about the population of interest. These could be univariate, bivariate or even multivariate statements.
Usually descriptive statistics are created based on census data or sample surveys to create some summary statistics like a mean, median or a graphical distribution to describe the population of interest. In the case of a census the work ends right there. With sample surveys the point estimates come with measures of uncertainties (standard errors). The estimation of standard errors has been worked out for most descriptive statistics and most common survey designs, even complex ones that include multiple layers of sampling and disproportional selection probabilities (Hansen, Hurwitz, and Madow 1993, Valliant, Dever, and Kreuter (2018)).
Example: Descriptive statistics
The Census Bureau’s American Community Survey (ACS) “helps local officials, community leaders, and businesses understand the changes taking place in their communities. It is the premier source for detailed population and housing information about our nation” (https://www.census.gov/programs-surveys/acs). The summary statistics are used by planners to allocate resources—but it’s important to pay attention to the standard errors, particularly for small samples. For example, in one county (Autauga) in Alabama, with a total population of about fifty-five thousand, the ACS estimates that 139 children under age 5 live in poverty—plus or minus 178! So the plausible range is somewhere between 0 and 317 (Spielman and Singleton 2015).
Proper inference from a sample survey to the population usually depends on knowing a) that everyone from the target population had the chance to be included in the survey, and b) the selection probability for each element in the population. The latter does not necessarily need to be known prior to sampling, but eventually a probability is assigned for each case. Getting the selection probabilities right is particularly important when reporting totals (Lohr 2009). Unfortunately in practice, samples that start out as probability samples can suffer from a high rate of nonresponse. Because the survey designer cannot completely control which units respond, the set of units that ultimately respond cannot be considered to be a probability sample. Nevertheless, starting with a probability sample provides some degree of comfort that a sample will have limited coverage errors (nonzero probability of being in the sample).
Causation
Identifying causal relationships is another common goal for social science researchers (Varian 2014). Ideally such explanations stem from data that allow causal inference: typically randomized experiments or strong non-experimental study designs. When examining the effect of X on Y, knowing how cases were selected into the sample or dataset is much less important to estimate causal effects than they are for descriptive studies, e.g., population means. What is important is that all elements of the inferential population have a chance to be selected for the treatment (Imbens and Rubin 2015). In the debate about probability and non-probability surveys, this distinction is often overlooked. Medical researchers have operated with unknown study selection mechanisms for years: e.g, randomized trials that enroll very selected samples.
Example: New data and causal inference
If the data generating process is not understood, resources can be badly misallocated. Overreliance on, say, Twitter data, in targeting resources after hurricanes can lead to the misallocation of resources towards young, internet savvy people with cell-phones and away from elderly or impoverished neighborhoods (Shelton et al. 2014). Of course, all data collection approaches have had similar risks. Bad survey methodology led the Literary Digest to incorrectly call the 1936 election (Squire 1988). Inadequate understanding of coverage, incentive and quality issues, together with the lack of a comparison group, has hampered the use of administrative records—famously in the case of using administrative records on crime to make inference about the role of death penalty policy in crime reduction (Donohue III and Wolfers 2006).
In practice, regardless of how much data is available, researchers must consider at least two things: 1) how well the results generalize to other populations (Athey and Imbens 2017) 2) whether the treatment effect on the treated population is different than the treatment effect in the full population of interest (Stuart 2010). New methods to address generalizability are under development (DuGoff, Schuler, and Stuart 2014). While unknown study selection probabilities usually makes it difficult to estimate population causal effects, as long as we are able to model the selection process there is no reason not to do causal inference from so-called non-probability data.
Prediction
Forecasting or prediction tasks. The potential for massive amounts of data to improve prediction is undeniable. However, just like the causal inference setting, it is of utmost importance that we know the process that generated the data, so that biases due to unknown or unobserved systematic selection can be minimized. Predictive policing is a good example of the challenges. The criminal justice system generates massive amounts of data that can be used to better allocate police resources—but if the data do not represent the population at large, the predictions could be biased, and more importantly, the interventions assigned using those predictions could harm society.
Example: Learning from the flu
“Five years ago in 2009, a team of researchers from Google announced a remarkable achievement in one of the world’s top scientific journals, Nature. Without needing the results of a single medical check-up, they were nevertheless able to track the spread of influenza across the US. What’s more, they could do it more quickly than the Centers for Disease Control and Prevention (CDC). Google’s tracking had only a day’s delay, compared with the week or more it took for the CDC to assemble a picture based on reports from doctors’ surgeries. Google was faster because it was tracking the outbreak by finding a correlation between what people searched for online and whether they had flu symptoms. …
“Four years after the original Nature paper was published, Nature News had sad tidings to convey: the latest flu outbreak had claimed an unexpected victim: Google Flu Trends. After reliably providing a swift and accurate account of flu outbreaks for several winters, the theory-free, data-rich model had lost its nose for where flu was going. Google’s model pointed to a severe outbreak but when the slow-and-steady data from the CDC arrived, they showed that Google’s estimates of the spread of flu-like illnesses were overstated by almost a factor of two.
“The problem was that Google did not know—could not begin to know—what linked the search terms with the spread of flu. Google’s engineers weren’t trying to figure out what caused what. They were merely finding statistical patterns in the data. They cared about correlation rather than causation” (Harford 2014).
1.4 The importance of understanding how data are generated
The costs of realizing the benefits of the new types of data are non trivial. Even if data collection is cheap, the costs of cleaning, curating, standardizing, integrating and using the new types of data are substantial. In essence, just as with data from surveys, data still need to be processed—cleaned, normalized, and variables coded—but this needs to be done at scale.2 But even once all of these tasks are completed, social scientists have a key role in describing the quality of the data. This role is important, because most data in the real world are noisy, inconsistent, and exhibit missing values. Data quality can be characterized in multiple ways (see Christen (2012b), National Academies of Sciences, Engineering, and Medicine and others (2018)), such as:
- Accuracy: How accurate are the attribute values in the data?
- Completeness: Are the data complete?
- Consistency: How consistent are the values in and between different database(s)?
- Timeliness: How timely are the data?
- Accessibility: Are all variables available for analysis?
In the social science world, the assessment of data quality is integral to the production of the resultant statistics. That is not necessarily easy when it comes to assessing new types of data. A good example of the importance of understanding how data are generated came up in one of our classes a couple of years ago, where class participants were asked to develop employment measures for ex-offenders in the period after they were released from prison (Kreuter, Ghani, and Lane 2019).
For people working with surveys, the definition is already preconstructed: in the Current Population Survey (CPS), respondents asked about their work activity in the week covering the 12th of the month. You’re counted as employed if you have at least one hour of paid work in that week (with some exceptions for family and farm work). But the class participants were working with administrative records from the Illinois Department of Employment Security and the Illinois Department of Corrections (Kreuter, Ghani, and Lane 2019). Those records provide a report of all jobs in every quarter that each individual holds in the state; when matched to data about formerly incarcerated individuals, it can provide rich information about their employment patterns. A group of class participants produced Figure 1.2—the white boxes represent quarters in which an individual doesn’t have a job and the blue boxes represent quarters in which an individual does have a job.
A quick look at the results is really interesting. First, the participants present an entirely new, dynamic, way of looking at employment—not just the relatively static CPS measure. Second, the results are a bit shocking. Over 61 per cent of Illinois exoffenders did not have a job in any of the 8 quarters after their release. Only 3.5 percent had a job in all of the quarters. This is where social scientists and government analysts can contribute—because they know how the data are generated. The matches between the two agencies are done on (deidentified) Social Security numbers (SSNs). It’s likely that there are several gaps in that match. First, agency staff know that the quality of SSNs in prisons is quite low, so that might be a reason for the low match rate. Second, the match is only to Illinois jobs, and many formerly incarcerated individuals could be working across state lines (if allowed). Third, they may have gone to community college, or on welfare, or back to prison. More data can be used to examine these different possibilities—but we think it illustrates the value that social scientists and subject matter experts provide to measuring the quality issues we highlighted at the beginning of this section.
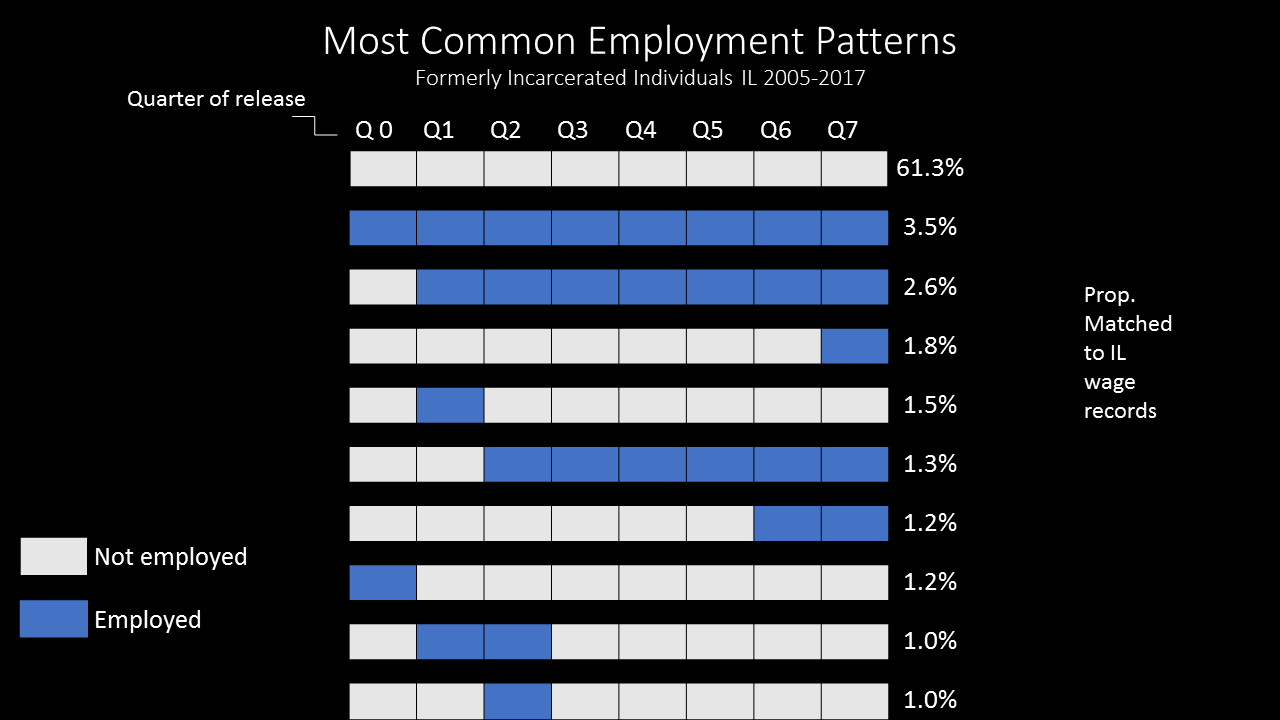
Figure 1.2: Most common employment patters, formerly incarcerated individuals in Illinois, 2005–2017
1.5 New tools for new data
The new data sources that we have discussed frequently require working at scales for which the social scientist’s familiar tools are not designed. Fortunately, the wider research and data analytics community has developed a wide variety of often more scalable and flexible tools—tools that we will introduce within this book.
Relational database management systems (DBMSs)3 are used throughout business as well as the sciences to organize, process, and search large collections of structured data. NoSQL DBMSs are used for data that is extremely large and/or unstructured, such as collections of web pages, social media data (e.g., Twitter messages), sensor data, and clinical notes. Extensions to these systems and also specialized single-purpose DBMSs provide support for data types that are not easily handled in statistical packages such as geospatial data, networks, and graphs.
Open source programming languages such as Python (used extensively throughout this book) and R provide high-quality implementations of numerous data analysis and visualization methods, from regression to machine learning, text analysis, network analysis, and much more. Finally, parallel computing platforms such as Hadoop and Spark can be used to harness parallel computing clusters for extremely large data sets and computationally intensive analyses.
These various components may not always work together as smoothly as do integrated packages such as SAS, SPSS, and Stata, but they allow researchers to take on problems of greater scale and complexity. Furthermore, they are developing at a tremendous rate as the result of work by thousands of people worldwide. For these reasons, the modern social scientist needs to be familiar with their capabilities.
1.6 The book’s “use case”
This book is about the uses of new types of computational and data analysis methods in social science. Our focus is on working through the use of data as a social scientist normally approaches research. That involves thinking through how to use such data to address a question from beginning to end, and thereby learning about the associated tools—rather than simply engaging in coding exercises and then thinking about how to apply them to a potpourri of social science examples.
There are many examples of the use of big data in social science research. Our challenge in designing the book was to find a use case that was interesting, that didn’t require access to confidential micro-data, that made use of all the methods and tools that a typical researcher might want to learn about, and that could be applied to most of the many other use cases that might be of interest to other instructors (such as criminal justice, health care, welfare, education or economic development). We chose to make use of the great surge of interest in examining the impact of investments in research and development on economic and social outcomes, and which constitutes one of the first large-scale big data social science data infrastructures. Many of the data sources are public, and it is those that are used in this book.
We think the question should also be of broad interest to many potential users, even if they’re not subject matter specialists. The surge of interest was in response to a call from the President’s Science Advisor (Jack Marburger) for a science of science policy (Marburger 2005). He wanted a scientific response to the questions that he was asked about the impact of investments in science.
Example: The Science of Science Policy
Marburger made some very insightful points during his tenure as Science Advisor. He was sceptical of the calls for more and more investment in science, particularly of the European push for 3% of GDP to be allocated to research and development. He wanted to both understand and be able to explain what would be the returns to that kind of expenditure. In a very famous editorial, he asked (Marburger 2005): “How much should a nation spend on science? What kind of science? How much from private versus public sectors? Does demand for funding by potential science performers imply a shortage of funding or a surfeit of performers? These and related science policy questions tend to be asked and answered today in a highly visible advocacy context that makes assumptions that are deserving of closer scrutiny. A new ‘science of science policy’ is emerging, and it may offer more compelling guidance for policy decisions and for more credible advocacy. …
“Relating R&D to innovation in any but a general way is a tall order, but not a hopeless one. We need econometric models that encompass enough variables in a sufficient number of countries to produce reasonable simulations of the effect of specific policy choices. This need won’t be satisfied by a few grants or workshops, but demands the attention of a specialist scholarly community. As more economists and social scientists turn to these issues, the effectiveness of science policy will grow, and of science advocacy too.”
In order to answer his question, an entire research field developed that pulled together relevant data from a wide variety of different sources using widely differing methodologies and approaches. They addressed challenges often faced by social science and computer science researchers trying to use new data to answer important questions—namely that inputs, outputs and outcomes are not generated or combined in a systematic fashion, even though producing consistent and reliable answers to stakeholder requests requires the use of common data sources and standardized methodologies. They were able to pull together new digital sources of data and apply modern technologies to analyze them. In the book we use three main examples to show how this was done. The first is to describe what research is being done, using data produced from multiple agencies on grand funding. The second is to use award and patent administrative records to describe who is doing the research (and with whom). The third is to use patent data to describe what results the funding has generated (Weinberg et al. 2014, Lane et al. (2018))
Showing how those challenges can be addressed fits in with the goal of the book. The focus is to highlight how to use new digital technologies to capture the data needed to understand and address a set of questions, with an illustrative focus on the broad results of Federal Science and Technology investments. We are able to draw on the public availability of a wide variety of research inputs, such as federal grant information, and some outputs, particularly patent data. We are also able to draw on new and more accurate methods exist for reliably attributing research products to researchers, a nontrivial task due to considerable ambiguity in author names (Han et al. 2004, Smalheiser and Torvik (2009), Li et al. (2014), Kim, Khabsa, and Giles (2016)). Figure 1.3 provides an abstract representation of the empirical approach that is needed: data about grants, the people who are funded on grants, and the subsequent scientific and economic activities and shows.
First, data must be captured on what is funded, and since the data are in text format, computational linguistics tools must be applied (Text Analysis). Second, data must be captured on who is funded, and how they interact in teams, so network tools and analysis must be used (Networks: The Basics). Third, information about the type of results must be gleaned from the web and other sources (Working with Web Data and APIs).
Finally, the disparate complex data sets need to be stored in databases (Databases), integrated (Record Linkage), analyzed (Machine Learning), and used to make inferences (Data Quality and Inference Errors).
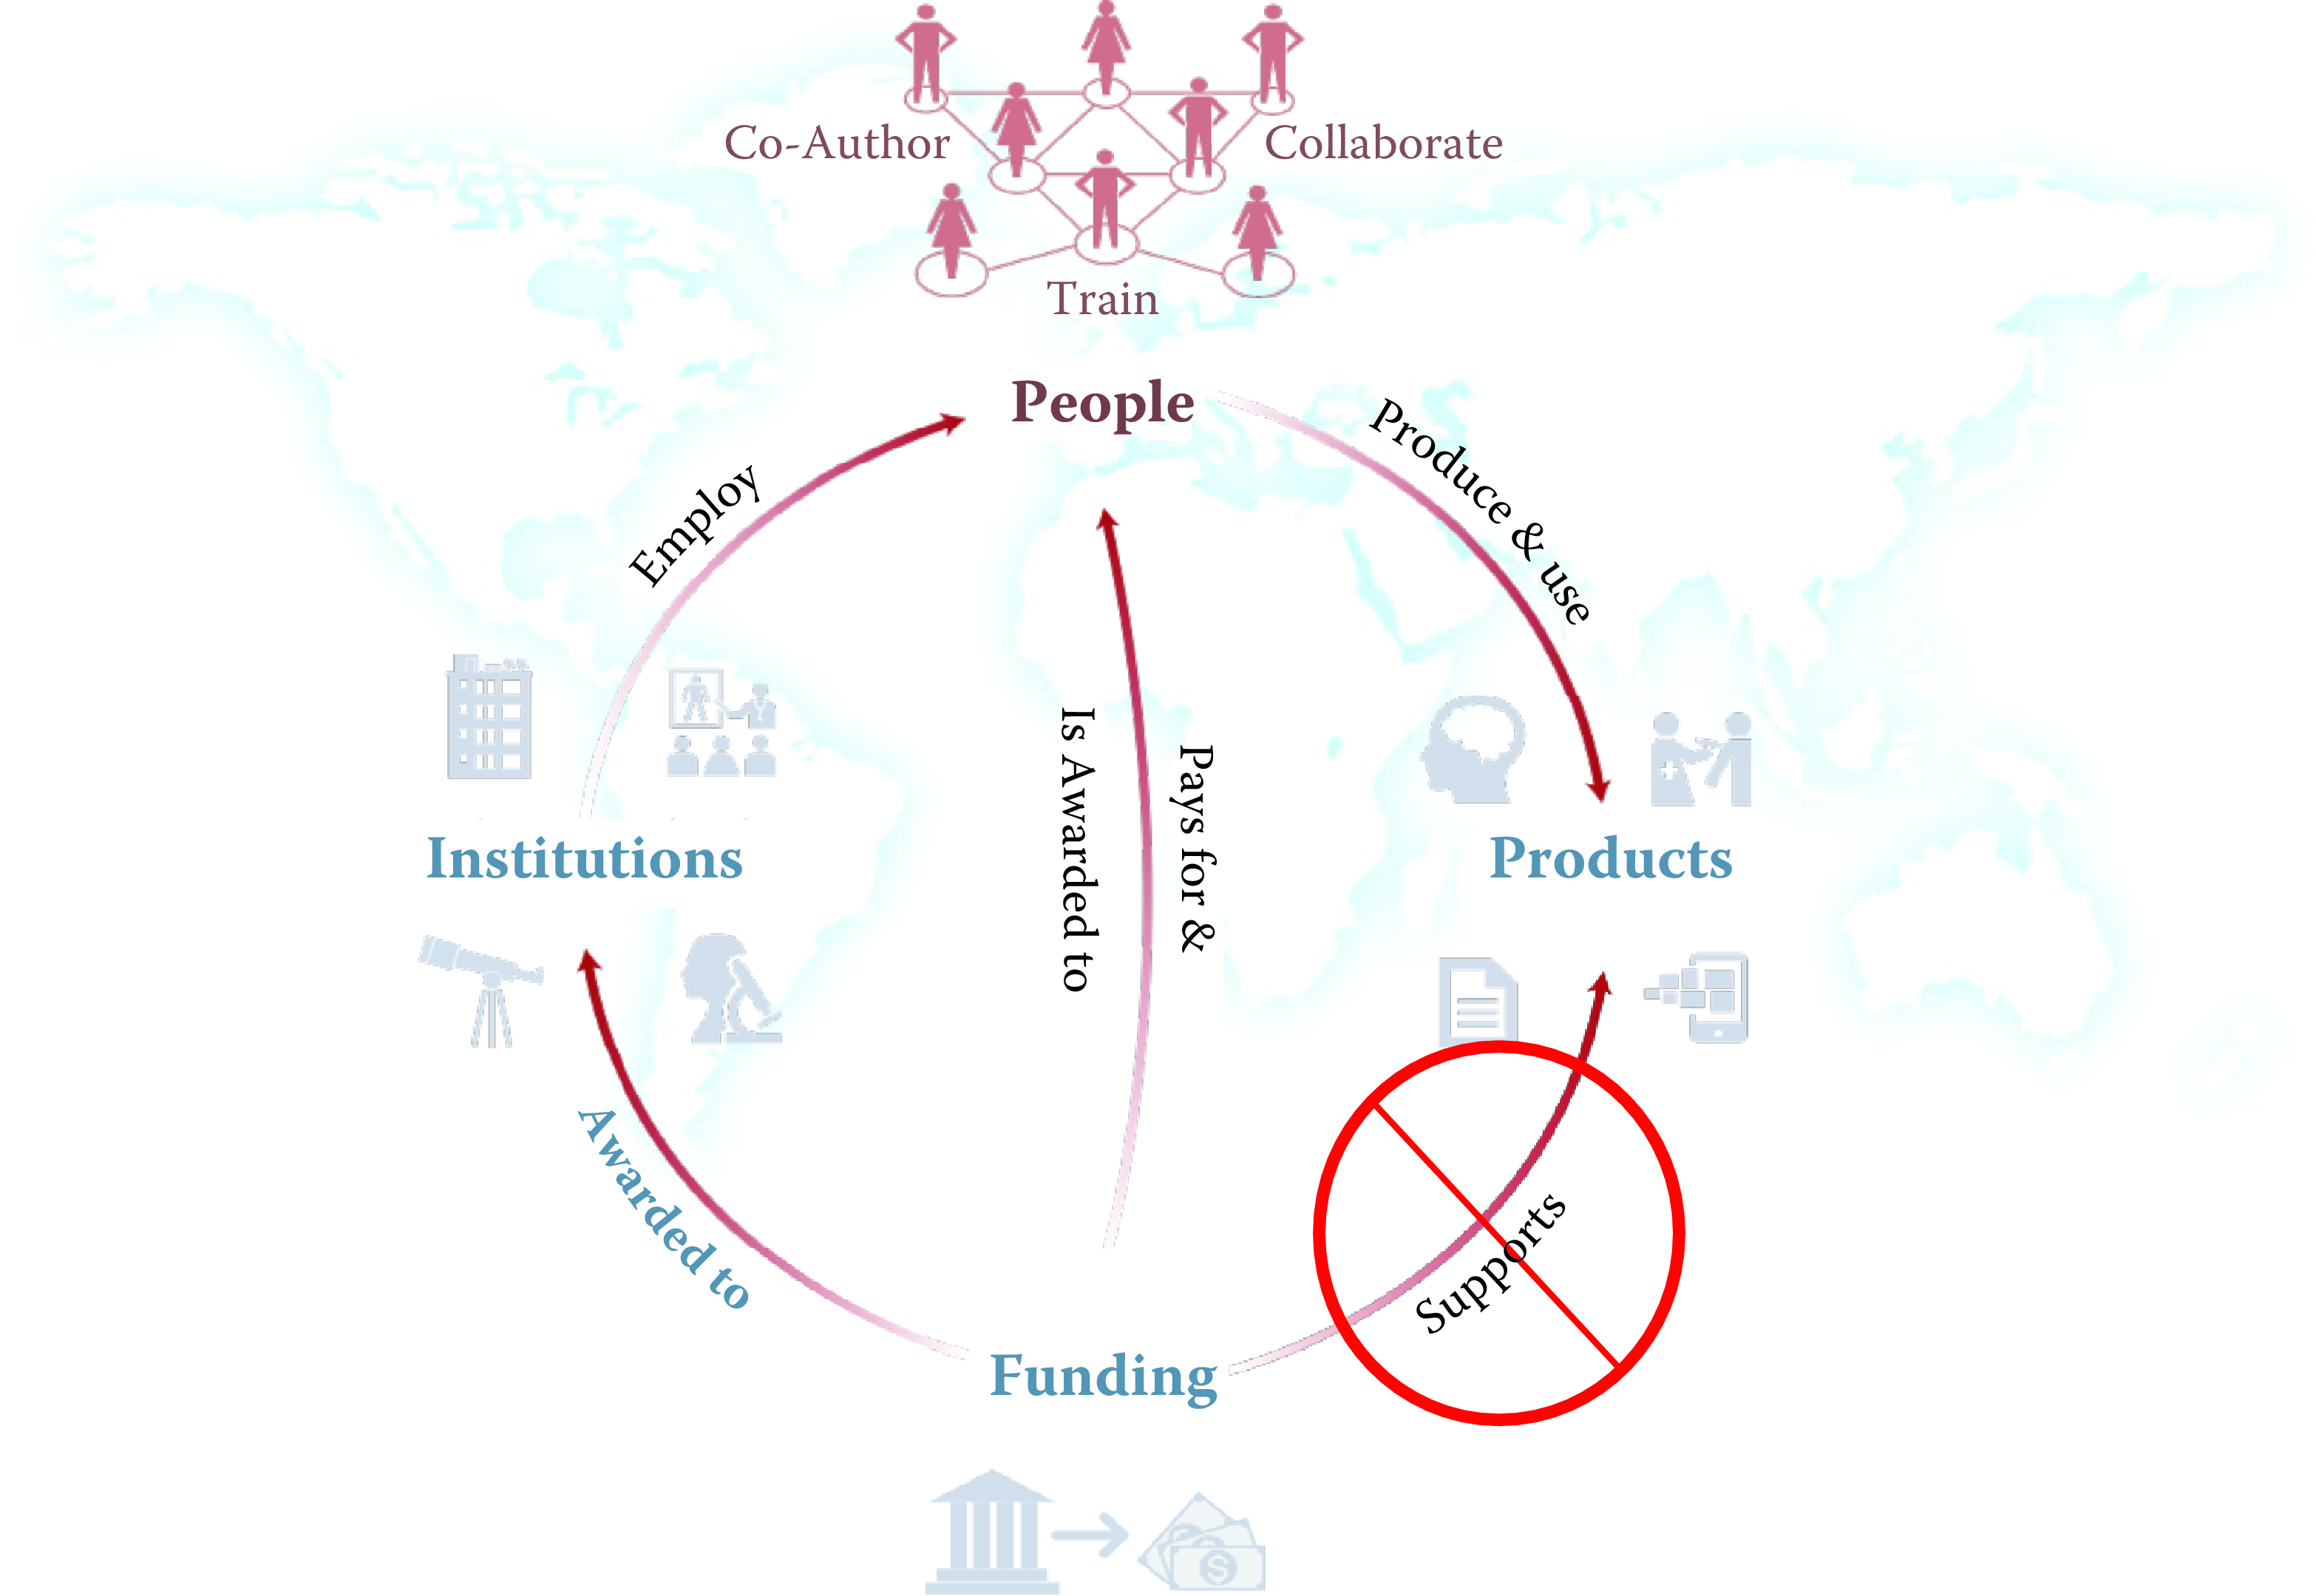
Figure 1.3: A visualization of the complex links between what and who is funded, and the results; tracing the direct link between funding and results is misleading and wrong
The use case serves as the thread that ties many of the ideas together. Rather than asking the reader to learn how to code “hello world,” we build on data that have been put together to answer a real-world question, and provide explicit examples based on that data. We then provide examples that show how the approach generalizes.
For example, the text analysis chapter (Text Analysis) shows how to use natural language processing to describe what research is being done, using proposal and award text to identify the research topics in a portfolio (Talley et al. 2011; Evans and Foster 2011). But then it also shows how the approach can be used to address a problem that is not just limited to science policy—the conversion of massive amounts of knowledge that is stored in text to usable information.
Similarly, the network analysis chapter (Networks: The Basics) gives specific examples using the UMETRICS data and shows how such data can be used to create new units of analysis—the networks of researchers who do science, and the networks of vendors who supply research inputs. It also shows how networks can be used to study a wide variety of other social science questions.
In another example, we use APIs4 provided by publishers to describe the results generated by research funding in terms of publications and other measures of scientific impact, but also provide code that can be repurposed for many similar APIs.
And, of course, since all these new types of data are provided in a variety of different formats, some of which are quite large (or voluminous), and with a variety of different timestamps (or velocity), we discuss how to store the data in different types of data formats.
Much more information is available at the Institute for Research on Innovation and Science (IRIS, https://iris.isr.umich.edu/) at the University of Michigan. The Institute has extended the data infrastructure to bring together both confidential and public data in a secure environment. They have worked with universities interested in documenting the results of their grant funding, they are able to trace the spending of almost 400,000 grants to over 600,000 individuals and 820,000 vendors—and show the direct effects on that funding on their subsequent scientific and economic activity (Institute For Research On Innovation And Science (IRIS) Research 2019). To date, over 100 researchers from dozens of institutions have worked with the new data infrastructure to provide an empirical response to Marburger’s call.
Although we focus on one particular use case, the methods covered in this book are broadly applicable across a variety of policy areas—indeed, we have used this book to teach classes in such fields as education, criminal justice, workforce and economic development and social services (https://coleridgeinitiative.org/training).
The methods have been used to answer questions such as:
‘What are the earnings and employment outcomes of individuals graduating from two and four year colleges?’
‘How does placement in different types of firms change the likelihood that the formerly incarcerated will recidivate?’
‘What factors increase the likelihood that welfare recipients on TANF (Temporary Assistance to Needy Families) will leave welfare?’
and
- ‘How do regulatory agencies move from reactive, complaint-based, health and safety inspections for workplaces and housing to a more proactive approach that focuses on prevention?’
Box: Data science skills and the provision of human services
The Offices of Family Assistance Office and of Planning, Research, and Evaluation in the Department of Health and Human Services’ Administration for Children and Families set up a TANF data collaborative (https://www.tanfdata.org/) to help professionals at TANF and related human services agencies develop key data science skills. The focus is on teaching participants how to scope a problem, do record linkage, apply machine learning and visualization tools and learn about privacy issues when working with confidential data.
1.7 The structure of the book
We organize the book in three parts, based around the way social scientists approach doing research. The first set of chapters addresses the new ways to capture, curate, and store data. The second set of chapters describes what tools are available to process and analyze data. The last set deals with the appropriate handling of data on individuals and organizations as well as what inferences can be drawn from the data and the analysis that was done. Of course, we assume that before starting with the data and analysis, we have spent time on formulating the problem or question that is being addressed. We don’t cover that in this book but refer readers to resources such as “Data Science Project Scoping”5 for more information.
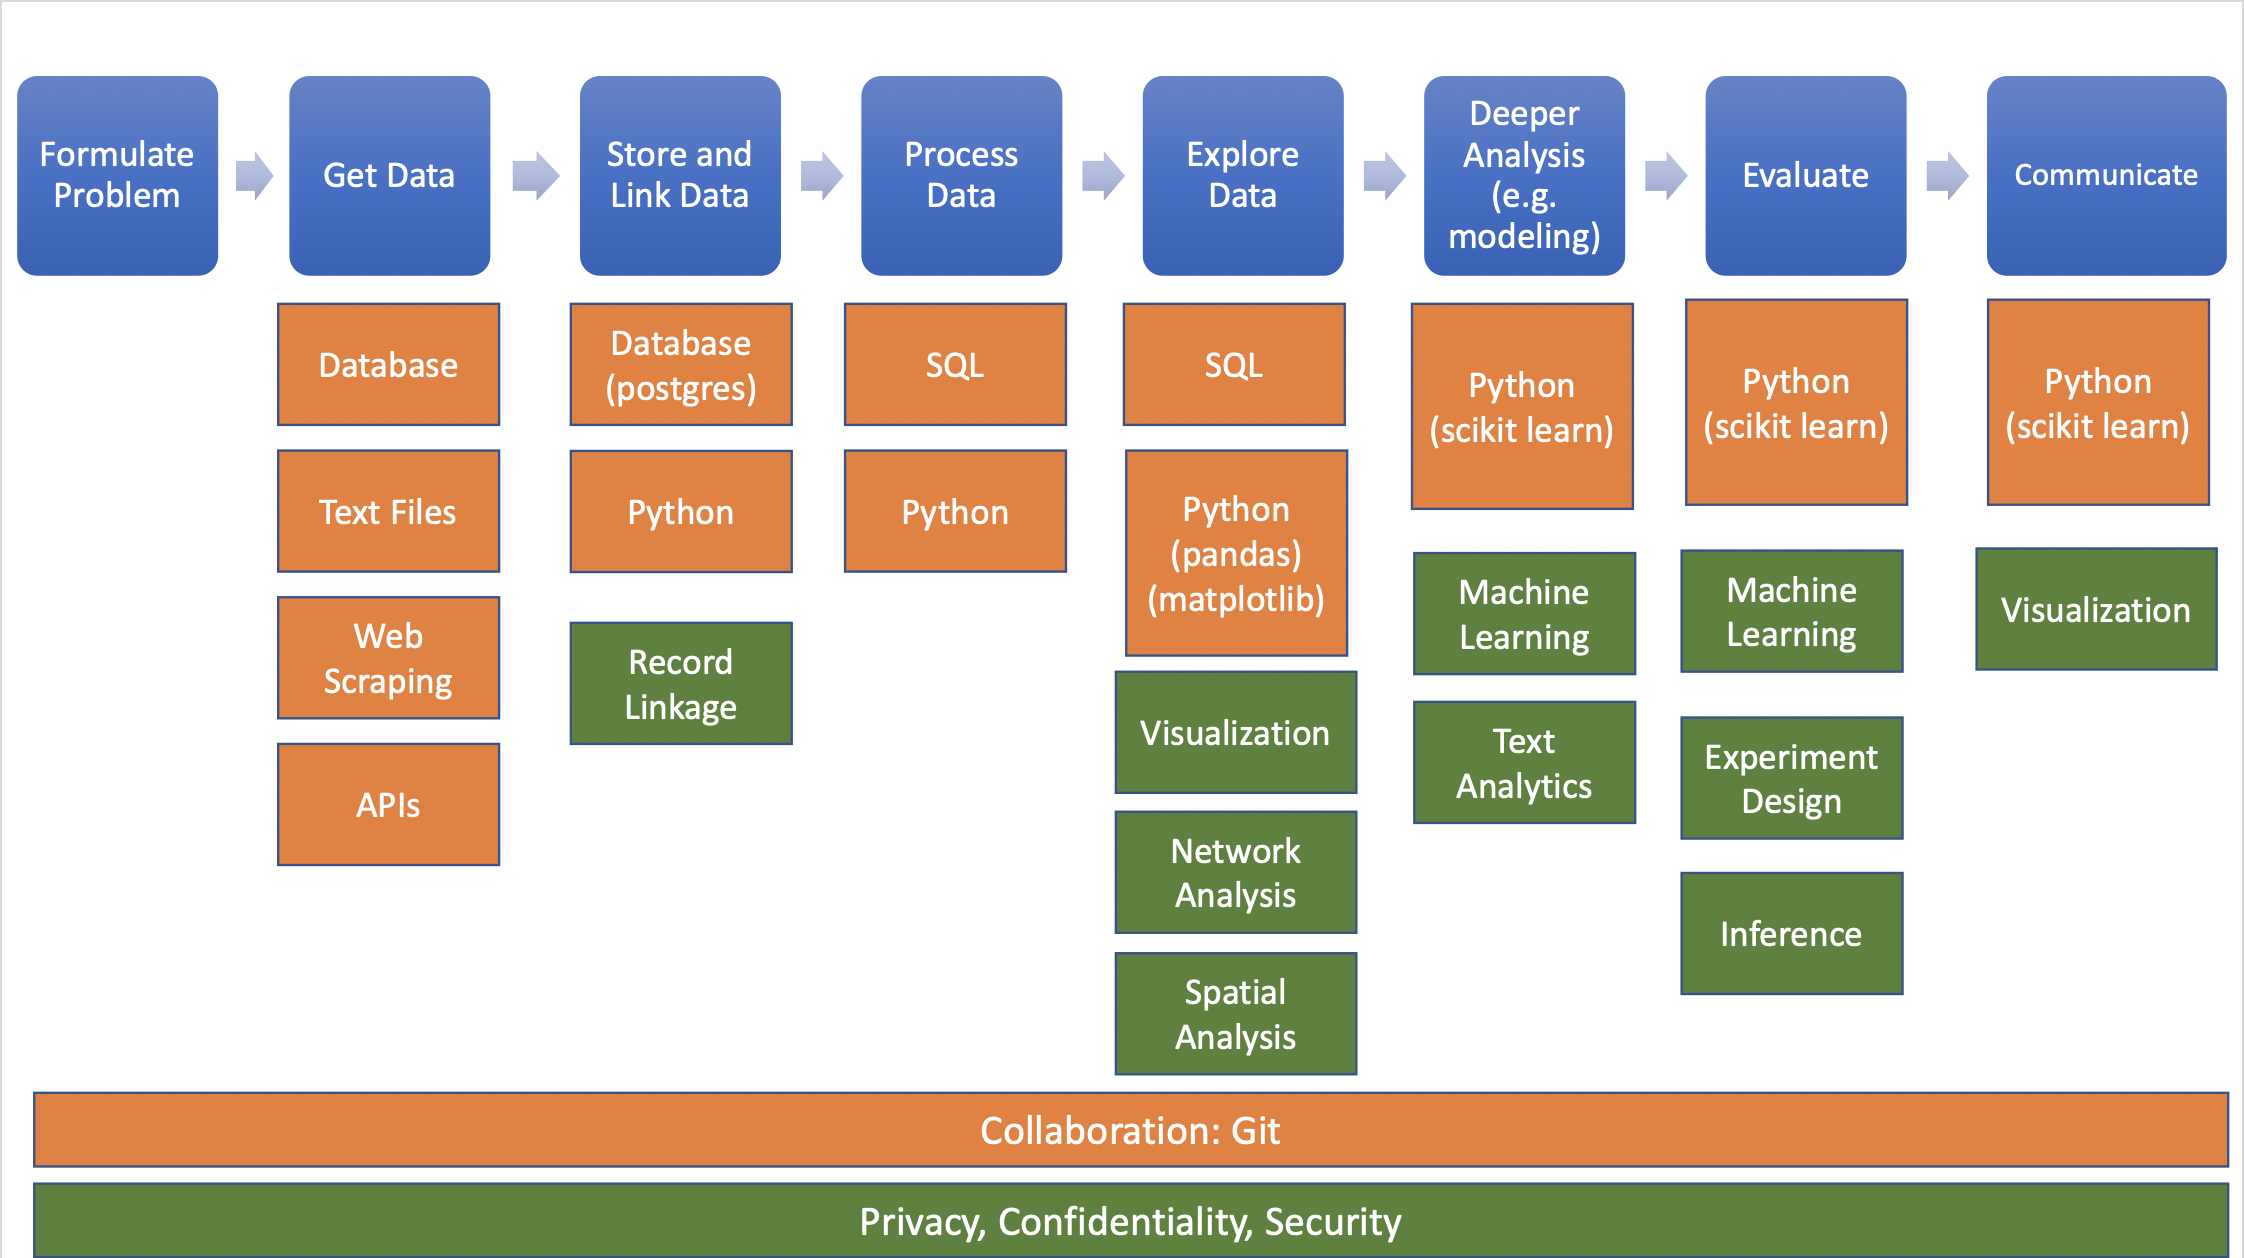
Figure 1.4: The data science project workflow. Blue represents each step in the project, orange represents the tools used in that step, and green represents the methods for analysis.
1.7.1 Part I: Capture and curation
The four chapters in Part I (see Figure 1.5) tell you how to collect, store, link, and manage data.
Working with Web Data and APIs describes how to extract information from data sources on the Web, including social media. The particular application will be to develop links to authors’ articles on Twitter using PLOS articles and to pull information about authors and articles from web sources by using an API. You will learn how to retrieve link data from bookmarking services, citations from Crossref, links from Facebook, and information from news coverage. In keeping with the social science grounding that is a core feature of the book, the chapter discusses what data can be captured from online sources, what is potentially reliable, and how to manage data quality issues.
This data differs from survey data in that we must typically combine data from multiple sources to get a complete picture of the activities of interest. Although computer scientists may sometimes simply “mash” data sets together, social scientists are rightfully concerned about issues of missing links, duplicative links, and erroneous links. Record Linkage provides an overview of traditional rule-based and probabilistic approaches to data linkage, as well as machine learning approaches that are more adaptive and tunable.
Once data have been collected and linked, it is necessary to store and organize it. Social scientists are used to working with one analytical file, often in statistical software tools such as SAS or Stata. Databases describes different approaches to storing data in ways that facilitate rapid, scalable, and reliable exploration and analysis.
Big data is sometimes defined as data that are too big to fit onto the analyst’s computer. Scaling up through Parallel and Distributed Computing provides an overview of programming techniques that facilitate the scalable use of data (often using parallel computing). While the focus is on one of the most widely used big data programming paradigms and its most popular implementation, Apache Hadoop, the goal of the chapter is to provide a conceptual framework to the key challenges that the approach is designed to address.
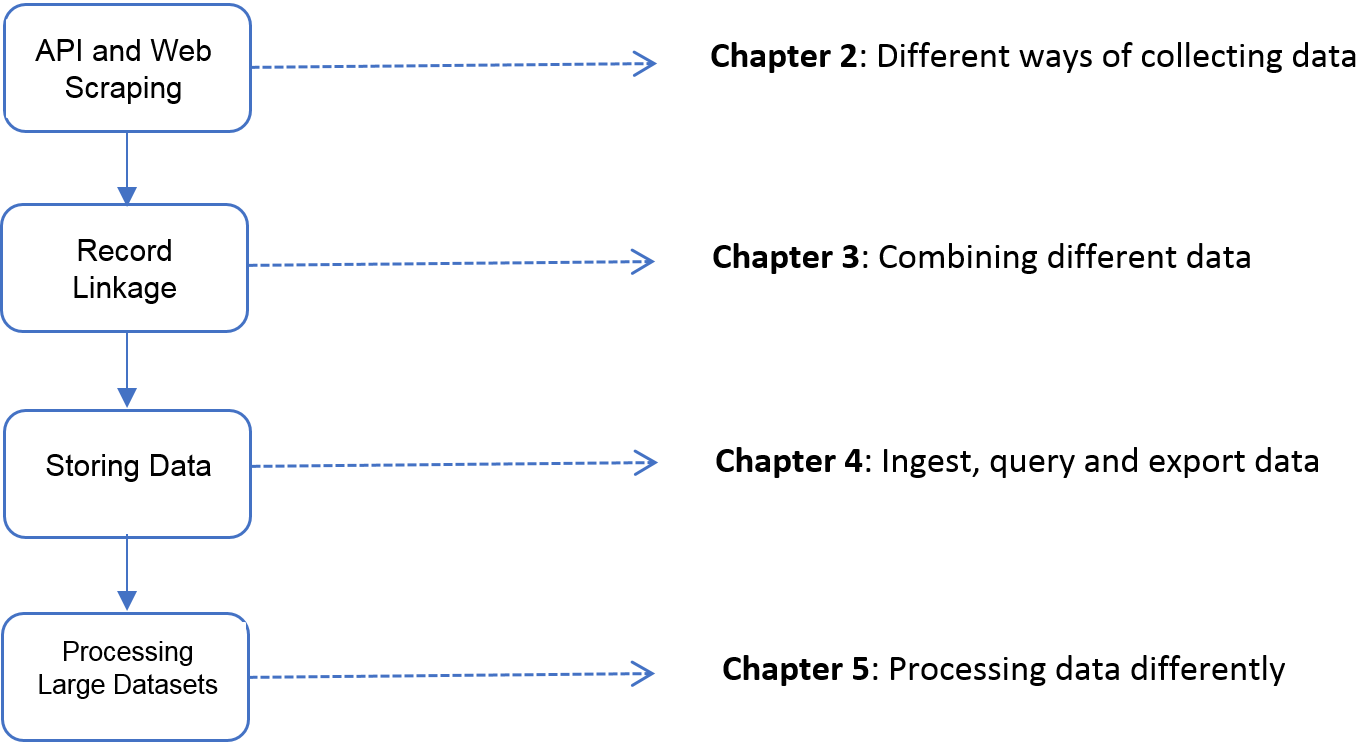
Figure 1.5: The four chapters of Part I focus on data capture and curation
1.7.2 Part II: Modeling and analysis
The four chapters in Part II (see Figure 1.6) introduce four of the most important tools that can be used by social scientists to do new and exciting research: information visualization, machine learning, text analysis, and social network analysis.
Information Visualization introduces information visualization methods and describes how you can use those methods to explore data and communicate results so that data can be turned into interpretable, actionable information. There are many ways of presenting statistical information that convey content in a rigorous manner. The goal of this chapter is to explore different approaches and examine the information content and analytical validity of the different approaches. It provides an overview of effective visualizations. Using visualization already in early analysis stages is key to a good understanding of data quality and potential pitfalls.
Machine Learning introduces machine learning methods. It shows the power of machine learning in a variety of different contexts, particularly focusing on clustering, classification, and prediction. You will get an overview of basic approaches and how those approaches are applied. The chapter builds from a conceptual framework on how to formulate social science problems as machine learning problems, how to perform machine learning analysis, and how to evaluate the analysis. These concepts are then translated into code to ensure that the analysis can be put into practical use by social science researchers and practitioners.
Text Analysis describes how social scientists can make use of text data through text analysis and natural language processing methods. Dealing with text and analysing text is not new to social scientists. What is different these days is that the vast amounts of data that are stored in documents can now be analyzed and searched and analyzed at scale, so that different types of information can be retrieved. Documents (and the underlying activities of the entities that generated the documents) can be categorized into topics or fields as well as summarized. In addition, machine translation can be used to compare documents in different languages.
Social scientists are typically interested in describing the activities of individuals and organizations (such as households and firms) in a variety of economic and social contexts. The frames within which data are collected have typically been generated from tax or other programmatic sources. The new types of data permit new units of analysis—particularly network analysis—largely enabled by advances in mathematical graph theory. Thus, Networks: The Basics describes how social scientists can use network theory to generate measurable representations of patterns of relationships connecting entities. As the author points out, the value of the new framework is not only in constructing different right-hand-side variables but also in studying an entirely new unit of analysis that lies somewhere between the largely atomistic actors that occupy the markets of neo-classical theory and the tightly managed hierarchies that are the traditional object of inquiry of sociologists and organizational theorists.
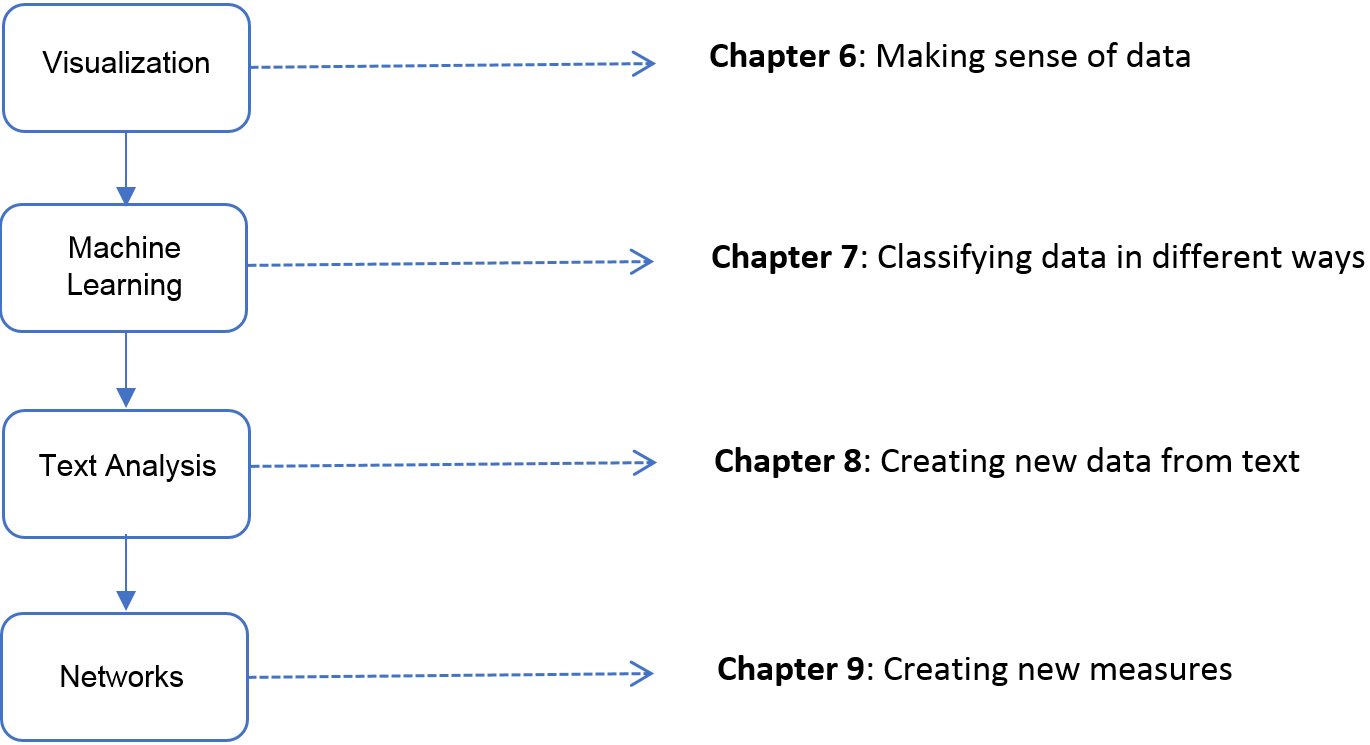
Figure 1.6: The four chapters in Part II focus on data modeling and analysis
1.7.3 Part III: Inference and ethics
The three chapters in Part III (see Figure 1.7) cover three advanced topics relating to data inference and ethics—errors and inference, bias, and privacy and confidentiality—and introduce the workbooks that provide access to the practical exercises associated with the text.
Data Quality and Inference Errors deals with inference and the errors associated with big data. Social scientists know only too well the cost associated with bad data—we highlighted the classic Literary Digest example in the introduction to this chapter, as well as the more recent Google Flu Trends. Although the consequences are well understood, the new types of data are so large and complex that their properties often cannot be studied in traditional ways. In addition, the data generating function is such that the data are often selective, incomplete, and erroneous. Without proper data hygiene, errors can quickly compound. This chapter provides a systematic way to think about the error framework in a big data setting.
Bias and Fairness Interest in algorithmic fairness and bias has been growing recently, but it’s easy to get lost in the large number of definitions and metrics. There are many different, often competing, ways to measure whether a given model and the resulting system is “fair”. In this chapter, we provide an overview of these metrics along with some concrete examples to help navigate these concepts and understand the trade-offs involved in choosing to optimize one metric over others.
Privacy and Confidentiality addresses the issue that sits at the core of any study of human beings—privacy and confidentiality. In a new field, like the one covered in this book, it is critical that many researchers have access to the data so that work can be replicated and built on—that there be a scientific basis to data science. Yet the rules that social scientists have traditionally used for survey data, namely anonymity and informed consent, no longer apply when the data are collected in the wild. This concluding chapter identifies the issues that must be addressed for responsible and ethical research to take place.
Finally, Workbooks provides an overview of the practical work that accompanies each chapter—the workbooks that are designed, using Jupyter notebooks6, to enable students and interested practitioners to apply the new techniques and approaches in selected chapters. This last chapter gives a broad overview of the tools needed to work with these workbooks and some instructions on how to use the workbooks if you decide to teach a class using this content. The chapter also informs broadly about the data and problems these workbooks tackle, and about the general structure of the workbooks. We are constantly expanding and updating the set of available workbooks, so check GitHub regularly if you want to see the latest version. We hope you have a lot of fun with them.
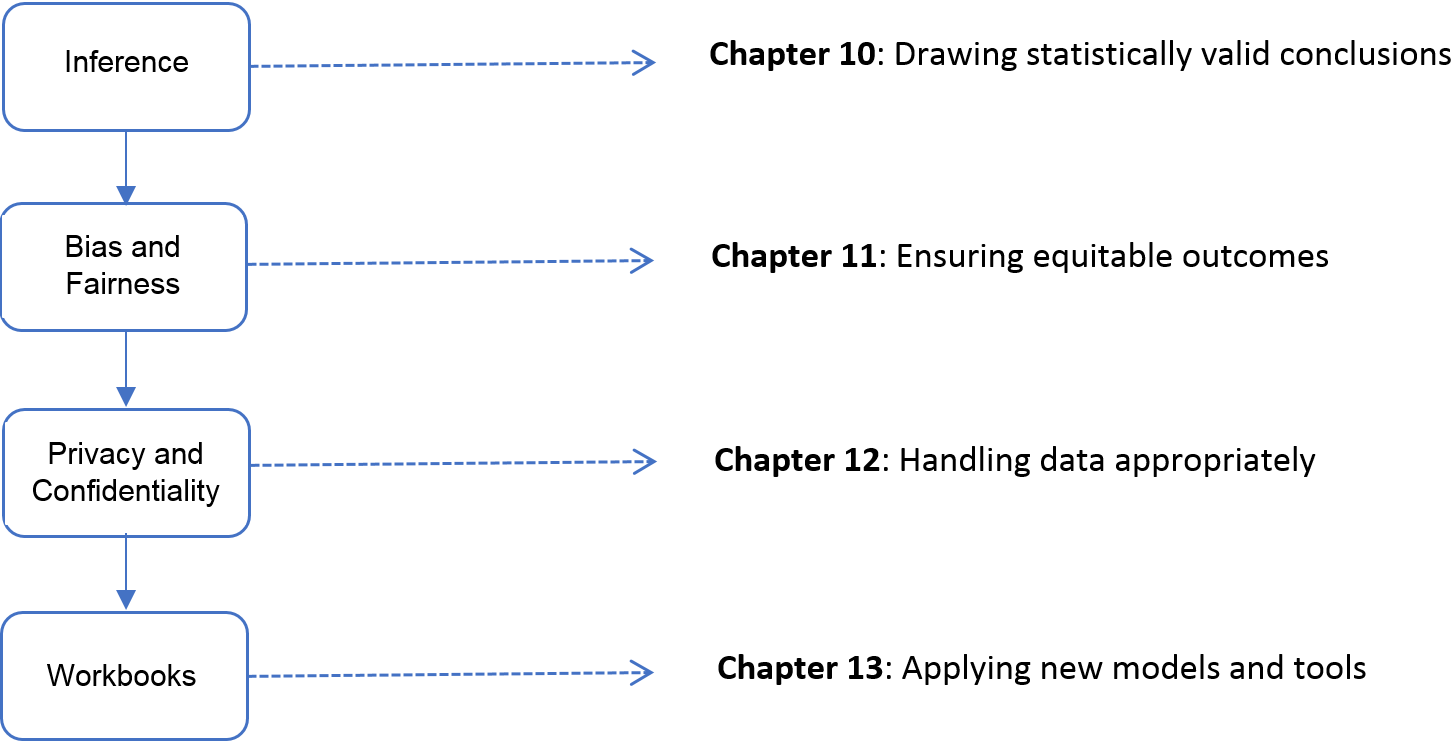
Figure 1.7: The four chapters in Part III focus on inference and ethics
1.8 Resources
For more information on the science of science policy, see Husbands et al.’s book for a full discussion of many issues (Husband Fealing et al. 2011) and peruse the awards made by the National Science Foundation’s Science of Science: Discovery, Communication, and Impact program (https://www.nsf.gov/funding/pgm_summ.jsp?pims_id=505730).
This book is above all a practical introduction to the methods and tools that the social scientist can use to make sense of big data, and thus programming resources are also important. We make extensive use of the Python programming language and databases in both the book and its supporting workbooks. We recommend that any social scientist who aspires to work with large data sets become proficient in the use of these two systems and GitHub. All three, fortunately, are quite accessible and are supported by excellent online resources. Time spent mastering them will be repaid many times over in more productive research.
For Python7, Alex Bell’s Python for Economists (available online (Bell 2012)) provides a wonderful 30-page introduction to the use of Python in the social sciences, complete with XKCD cartoons. Economists Tom Sargent and John Stachurski provide a very useful set of lectures and examples at http://quant-econ.net/. For more detail, we recommend Charles Severance’s Python for Informatics: Exploring Information (Severance 2013), which not only covers basic Python but also provides material relevant to web data (the subject of Working with Web Data and APIs) and MySQL (the subject of Databases). This book is also freely available online and is supported by excellent online lectures and exercises.
For SQL, Chapter Databases provides introductory material and pointers to additional resources, so we will not say more here.
We also recommend that you master GitHub. A version control system is a tool for keeping track of changes that have been made to a document over time. GitHub is a hosting service for projects that use the Git version control system. As Strasser explains (Strasser 2014), Git/GitHub makes it straightforward for researchers to create digital lab notebooks that record the data files, programs, papers, and other resources associated with a project, with automatic tracking of the changes that are made to those resources over time. GitHub also makes it easy for collaborators to work together on a project, whether a program or a paper: changes made by each contributor are recorded and can easily be reconciled. For example, we used GitHub to create this book, with authors and editors checking in changes and comments at different times and from many time zones. We also use GitHub to provide access to the supporting workbooks. Ram (Ram 2013) provides a nice description of how Git/GitHub can be used to promote reproducibility and transparency in research.
One more resource that is outside the scope of this book but that you may well want to master is the cloud (Armbrust et al. 2010; Lifka et al. 2013). It used to be that when your data and computations became too large to analyze on your laptop, you were out of luck unless your employer (or a friend) had a larger computer. With the emergence of cloud storage and computing services from the likes of Amazon Web Services, Google, and Microsoft, powerful computers are available to anyone with a credit card. We and many others have had positive experiences using such systems for the analysis of urban (Catlett et al. 2014), environmental (Elliott et al. 2014), and genomic (Bhuvaneshwar et al. 2015) data analysis and modeling, for example.
References
Armbrust, Michael, Armando Fox, Rean Griffith, Anthony D. Joseph, Randy Katz, Andy Konwinski, Gunho Lee, et al. 2010. “A View of Cloud Computing.” Communications of the ACM 53 (4). ACM: 50–58.
Athey, Susan, and Guido W. Imbens. 2017. “The State of Applied Econometrics: Causality and Policy Evaluation.” Journal of Economic Perspectives 31 (2): 3–32.
Bell, Alex. 2012. “Python for Economists.” https://scholar.harvard.edu/files/ambell/files/python_for_economists.pdf Accessed February 1, 2020.
Bhuvaneshwar, Krithika, Dinanath Sulakhe, Robinder Gauba, Alex Rodriguez, Ravi Madduri, Utpal Dave, Lukasz Lacinski, Ian Foster, Yuriy Gusev, and Subha Madhavan. 2015. “A Case Study for Cloud Based High Throughput Analysis of NGS Data Using the Globus Genomics System.” Computational and Structural Biotechnology Journal 13. Elsevier: 64–74.
Brady, Henry E. 2019. “The Challenge of Big Data and Data Science.” Annual Review of Political Science 22. Annual Reviews: 297–323.
Brynjolfsson, Erik, Lorin M. Hitt, and Heekyung Hellen Kim. 2011. “Strength in Numbers: How Does Data-Driven Decisionmaking Affect Firm Performance?” Available at SSRN: https://ssrn.com/abstract=1819486.
Catlett, Charlie, Tanu Malik, Brett Goldstein, Jonathan Giuffrida, Yetong Shao, Alessandro Panella, Derek Eder, et al. 2014. “Plenario: An Open Data Discovery and Exploration Platform for Urban Science.” Bulletin of the IEEE Computer Society Technical Committee on Data Engineering 37: 27–42.
Cavallo, Alberto, and Roberto Rigobon. 2016. “The Billion Prices Project: Using Online Prices for Measurement and Research.” Journal of Economic Perspectives 30 (2): 151–78.
Chetty, Raj. 2012. “The Transformative Potential of Administrative Data for Microeconometric Research.” http://conference.nber.org/confer/2012/SI2012/LS/ChettySlides.pdf. Accessed February 1, 2016.
Christen, Peter. 2012b. Data Matching: Concepts and Techniques for Record Linkage, Entity Resolution, and Duplicate Detection. Springer Science & Business Media.
Donohue III, John J., and Justin Wolfers. 2006. “Uses and Abuses of Empirical Evidence in the Death Penalty Debate.” National Bureau of Economic Research.
DuGoff, Eva H., Megan Schuler, and Elizabeth A. Stuart. 2014. “Generalizing Observational Study Results: Applying Propensity Score Methods to Complex Surveys.” Health Services Research 49 (1). Wiley Online Library: 284–303.
Edelman, Benjamin, Michael Luca, and Dan Svirsky. 2017. “Racial Discrimination in the Sharing Economy: Evidence from a Field Experiment.” American Economic Journal: Applied Economics 9 (2): 1–22.
Elliott, Joshua, David Kelly, James Chryssanthacopoulos, Michael Glotter, Kanika Jhunjhnuwala, Neil Best, Michael Wilde, and Ian Foster. 2014. “The Parallel System for Integrating Impact Models and Sectors (pSIMS).” Environmental Modelling & Software 62. Elsevier: 509–16.
Evans, David S. 1987. “Tests of Alternative Theories of Firm Growth.” Journal of Political Economy 95. JSTOR: 657–74.
Evans, James A., and Jacob G. Foster. 2011. “Metaknowledge.” Science 331 (6018): 721–25.
Glaeser, Edward. 2019. “Urban Management in the 21st Century: Ten Insights from Professor Ed Glaeser.” Centre for Development; Enterprise (CDE).
Greenwood, Daniel, Arkadiusz Stopczynski, Brian Sweatt, Thomas Hardjono, and Alex Pentland. 2014. “The New Deal on Data: A Framework for Institutional Controls.” In Privacy, Big Data, and the Public Good: Frameworks for Engagement, edited by Julia Lane, Victoria Stodden, Stefan Bender, and Helen Nissenbaum. Cambridge University Press.
Han, Hui, Lee Giles, Hongyuan Zha, Cheng Li, and Kostas Tsioutsiouliklis. 2004. “Two Supervised Learning Approaches for Name Disambiguation in Author Citations.” In Proceedings of the Joint Acm/Ieee Conference on Digital Libraries, 296–305. IEEE.
Hansen, Morris H., William N. Hurwitz, and William G. Madow. 1993. Sample Survey Methods and Theory. John Wiley & Sons.
Harford, Tim. 2014. “Big Data: A Big Mistake?” Significance 11 (5): 14–19.
Hart, Nick. 2019. “Two Years of Progress on Evidence-Based Policymaking in the United States.” Data Coalition Blog. Washington DC: The Data Colaition. https://www.datacoalition.org/two-years-of-progress-on-evidence-based-policymaking-in-the-united-states/.
Husband Fealing, Kaye, Julia Ingrid Lane, Jack Marburger, and Stephanie Shipp. 2011. Science of Science Policy: The Handbook. Stanford University Press.
Imbens, Guido W., and Donald B. Rubin. 2015. Causal Inference for Statistics, Social, and Biomedical Sciences: An Introduction. Cambridge University Press.
Institute For Research On Innovation And Science (IRIS) Research. 2019. Summary Documentation for the IRIS UMETRICS 2019 Data Release. Institute for Research on Innovation; Science (IRIS). https://iris.isr.umich.edu/research-data/2019datarelease-summarydoc/.
Japec, Lilli, Frauke Kreuter, Marcus Berg, Paul Biemer, Paul Decker, Cliff Lampe, Julia Lane, Cathy O’Neil, and Abe Usher. 2015. “Big Data in Survey Research: AAPOR Task Force Report.” Public Opinion Quarterly 79 (4). AAPOR: 839–80.
Jovanovic, Boyan. 1982. “Selection and the Evolution of Industry.” Econometrica: Journal of the Econometric Society 50 (3). JSTOR: 649–70.
Kim, Kunho, Madian Khabsa, and C Lee Giles. 2016. “Inventor Name Disambiguation for a Patent Database Using a Random Forest and Dbscan.” In 2016 IEEE/ACM Joint Conference on Digital Libraries (JCDL), 269–70. IEEE.
Kopf, Dan. 2018. “This year’s Nobel Prize in economics was awarded to a Python convert.” Quartz. https://qz.com/1417145/economics-nobel-laureate-paul-romer-is-a-python-programming-convert/.
Kreuter, Frauke, Rayid Ghani, and Julia Lane. 2019. “Change Through Data: A Data Analytics Training Program for Government Employees.” Harvard Data Science Review 1 (2).
Lane, Julia, Jason Owen-Smith, Joseph Staudt, and Bruce A. Weinberg. 2018. “New Measurement of Innovation.” In Center for Economic Studies and Research Data Centers Research Report: 2017, edited by US Census Bureau. Washington DC: U.S. Census Bureau.
Li, Guan-Cheng, Ronald Lai, Alexander D’Amour, David M. Doolin, Ye Sun, Vetle I. Torvik, Z. Yu Amy, and Lee Fleming. 2014. “Disambiguation and Co-Authorship Networks of the Us Patent Inventor Database (1975–2010).” Research Policy 43 (6). Elsevier: 941–55.
Lifka, D., I. Foster, S. Mehringer, M. Parashar, P. Redfern, C. Stewart, and S. Tuecke. 2013. “XSEDE Cloud Survey Report.” Technical report, National Science Foundation, USA, http://hdl.handle.net/2142/45766.
Lohr, Sharon. 2009. Sampling: Design and Analysis. Cengage Learning.
Lynch, James. 2018. “Not Even Our Own Facts: Criminology in the Era of Big Data.” Criminology 56 (3). Wiley Online Library: 437–54.
Marburger, John H. 2005. “Wanted: Better Benchmarks.” Science 308 (5725). American Association for the Advancement of Science: 1087.
Mas, Alexandre, and Enrico Moretti. 2009. “Peers at Work.” American Economic Review 99 (1): 112–45.
National Academies of Sciences, Engineering, and Medicine and others. 2018. Federal Statistics, Multiple Data Sources, and Privacy Protection: Next Steps. National Academies Press.
Office of Management and Budget. 2019. “M-19-23: Phase 1 Implementation of the Foundations for Evidence-Based Policymaking Act of 2018: Learning Agendas, Personnel, and Planning Guidance.” Washington DC: https://www.whitehouse.gov/wp-content/uploads/2019/07/M-19-23.pdf.
Pan, Ian, Laura B Nolan, Rashida R Brown, Romana Khan, Paul van der Boor, Daniel G Harris, and Rayid Ghani. 2017. “Machine Learning for Social Services: A Study of Prenatal Case Management in Illinois.” American Journal of Public Health 107 (6). American Public Health Association: 938–44.
Peterson, Andrew, and Arthur Spirling. 2018. “Classification Accuracy as a Substantive Quantity of Interest: Measuring Polarization in Westminster Systems.” Political Analysis 26 (1). Cambridge University Press: 120–28.
Ram, Karthik. 2013. “Git Can Facilitate Greater Reproducibility and Increased Transparency in Science.” Source Code for Biology and Medicine 8 (1).
Schwartz, Amy Ellen, Michele Leardo, Siddhartha Aneja, and Brian Elbel. 2016. “Effect of a School-Based Water Intervention on Child Body Mass Index and Obesity.” JAMA Pediatrics 170 (3). American Medical Association: 220–26.
Severance, Charles. 2013. “Python for Informatics: Exploring Information.” http://www.pythonlearn.com/book.php; CreateSpace.
Shelton, Taylor, Ate Poorthuis, Mark Graham, and Matthew Zook. 2014. “Mapping the Data Shadows of Hurricane Sandy: Uncovering the Sociospatial Dimensions of ‘Big Data’.” Geoforum 52. Elsevier: 167–79.
Spielman, Seth E., and Alex Singleton. 2015. “Studying Neighborhoods Using Uncertain Data from the American Community Survey: A Contextual Approach.” Annals of the Association of American Geographers 105 (5): 1003–25.
Squire, Peverill. 1988. “Why the 1936 Literary Digest Poll Failed.” Public Opinion Quarterly 52 (1). AAPOR: 125–33.
Stanton, Mark W, and MK Rutherford. 2006. The High Concentration of Us Health Care Expenditures. Agency for Healthcare Research; Quality.
Strasser, Carly. 2014. “Git/GitHub: A Primer for Researchers.” http://datapub.cdlib.org/2014/05/05/github-a-primer-for-researchers/.
Stuart, Elizabeth A. 2010. “Matching Methods for Causal Inference: A Review and a Look Forward.” Statistical Science 25 (1). NIH Public Access: 1.
Talley, Edmund M., David Newman, David Mimno, Bruce W. Herr, Hanna M. Wallach, Gully A. P. C. Burns, A. G. Miriam Leenders, and Andrew McCallum. 2011. “Database of NIH Grants Using Machine-Learned Categories and Graphical Clustering.” Nature Methods 8 (6): 443–44.
Valliant, Richard, Jill A. Dever, and Frauke Kreuter. 2018. Practical Tools for Designing and Weighting Survey Samples. 2nd Edition. Springer.
Varian, Hal R. 2014. “Big Data: New Tricks for Econometrics.” Journal of Economic Perspectives 28 (2): 3–28.
Weinberg, Bruce A., Jason Owen-Smith, Rebecca F. Rosen, Lou Schwarz, Barbara McFadden Allen, Roy E. Weiss, and Julia Lane. 2014. “Science Funding and Short-Term Economic Activity.” Science 344 (6179). American Association for the Advancement of Science: 41–43.
Yarkoni, Tal, Dean Eckles, James Heathers, Maggie Levenstein, Paul Smaldino, and Julia I. Lane. 2019. “Enhancing and Accelerating Social Science via Automation: Challenges and Opportunities.” DARPA.
This topic is discussed in more detail in Chapter Scaling up through Parallel and Distributed Computing.↩
This topic is discussed in more detail in Section New tools for new data.↩
This topic is discussed in more detail in Chapter Databases.↩
Application Programming Interfaces↩
http://www.dssgfellowship.org/2016/10/27/scoping-data-science-for-social-good-projects/↩